
Proving ROI to the C-Suite: Aligning Course Metrics with Operational KPIs
Completion rates won't earn you budget in the boardroom. Here is how to map instructional outcomes directly to operational metrics executives actually track.
Executive Summary
Completion rates are the easiest L&D metric to report and the least persuasive in a executive boardroom. A 95% completion rate tells the C-suite that employees clicked through slides—it says nothing about whether business performance actually improved.
Proving genuine Return on Investment (ROI) requires moving beyond vanity metrics and connecting learning initiatives to operational key performance indicators (KPIs). By starting with business goals, isolating impact variables, and communicating in financial and operational terms, L&D transforms from a cost center into a strategic driver of revenue and efficiency.
Key Takeaways (TL;DR)
Completion rate is a vanity metric: Executives care about behavior change and operational impact, not click-through rates.
Start at the finish line: Work backward from existing business KPIs (e.g., ramp time, error rates, safety incidents) before designing content.
Focus on Kirkpatrick Levels 3 & 4: Shift board reporting away from smile sheets (Level 1) and quiz scores (Level 2) toward behavior (Level 3) and business results (Level 4).
Isolate variables honestly: Use control groups or baseline trendlines to build defensible ROI claims rather than overpromising.
Speak executive language: Translate instructional terms into dollars, time saved, risk reduction, and operational throughput.
The Metric Shift: Vanity vs. Impact
Reporting training success to executives requires changing the measurements you highlight:

Trait | Vanity L&D Metrics (Levels 1 & 2) | Executive ROI Metrics (Levels 3 & 4) |
Primary Metric | Course completion %, survey satisfaction | Onboarding ramp time, error rates, scrap rates |
Boardroom Value | Low (indicates activity, not outcome) | High (indicates operational efficiency & ROI) |
Stakeholder Sync | Unilateral L&D reporting | Joint accountability with operational leads |
Language Used | "Modules completed," "Quiz score average" | "Days saved," "Cost per unit," "Risk reduced" |
The 4 Steps to Build Boardroom-Ready L&D Metrics
1. Work Backward from Existing Business KPIs
Before creating a single slide or script, identify the exact operational metric leadership is already tracking. Involve operational leaders during discovery to establish:
The Baseline: What is the metric's current baseline? (e.g., average onboarding ramp is 45 days).
The Target: What shift would represent success? (e.g., reducing ramp to 35 days).
The Shared Commitment: Agree upfront that moving this specific number will define project success.
Rule of Thumb: If an operational leader cannot name the business metric this training is supposed to fix, pause development until that KPI is clearly defined.
2. Focus Boardroom Reporting on Kirkpatrick Levels 3 & 4
While post-course quizzes (Level 2) confirm knowledge transfer, executives view them as table stakes. The C-suite conversation must center strictly on:
Level 3 (Behavior Change): Are employees actually doing something differently on the shop floor, in sales calls, or in software workflows?
Level 4 (Business Results): Is that behavioral shift moving the operational metrics the business tracks daily?
3. Isolate the Impact of Training (Defensively)
Attributing operational improvements solely to L&D can invite skepticism from finance leaders. To present a defensible story:
Use Control Cohorts: Compare the performance of a trained team against a similar, untrained team over the same timeframe.
Track Pre/Post Baseline Trends: Monitor metrics in an environment where no other major operational or process changes occurred simultaneously.
Acknowledge External Variables: Earn credibility by openly acknowledging other factors (e.g., new software tools, market conditions) alongside L&D's contribution.
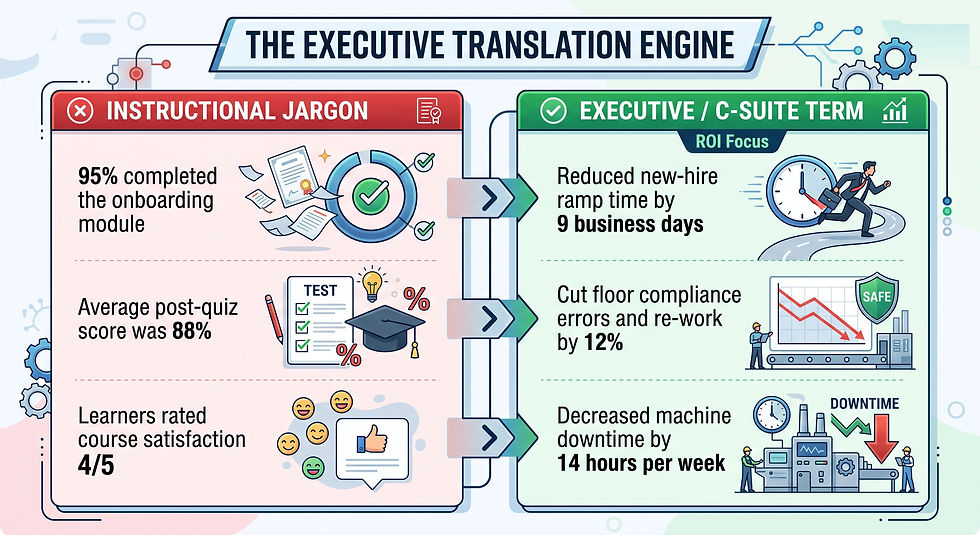
4. Translate Instructional Language to C-Suite Vocabulary
Replace instructional design jargon with operational and financial terminology:
Practitioner Playbook: Executing the C-Suite Alignment Cycle
Conduct the "Metric Intake" Sync: Ask stakeholders: "What metric on your quarterly dashboard will improve if this training succeeds?"
Set Up Pre- and Post-Launch Tracking: Lock in baseline data 30 days before course launch and establish automated data pulls for 30, 60, and 90 days after.
Co-Present with Operations: Present training impact results to executive leadership alongside the operational manager, not as an isolated L&D presentation.
Final Thoughts & Discussion
Proving L&D value isn't about collecting more data—it's about measuring what the business already cares about. When you align instructional design with operational KPIs, training shifts from an organizational expense to a competitive advantage.
Over to you: How does your organization demonstrate training ROI to leadership? What strategies have helped you tie learning metrics to business outcomes?


Comments